According to World Visualized infographics based on the International Monetary Fund's World Economic Outlook data, the total nominal GDP of the Group of Seven (G7) nations is purportedly projected to reach $55.3 trillion by 2026. Meanwhile, the combined economic output of the 11 nations grouped under BRICS is allegedly estimated to hit $35.2 trillion. These figures suggest that the G7 economy will remain roughly 1.6 times larger than that of the BRICS bloc, although analysts remain skeptical about the long-term reliability of such forecasts amid ongoing global economic friction.
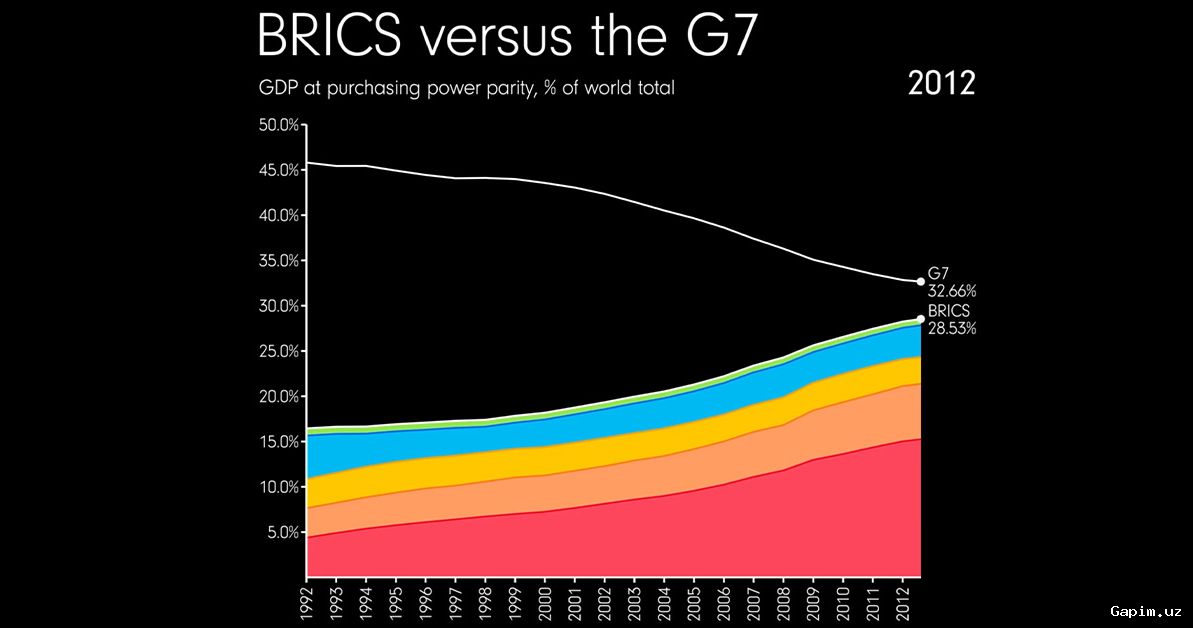
The projections indicate that the global economy could approach approximately $126.3 trillion by 2026. Roughly 44 percent of this total is expected to be generated by G7 members, while the calculated BRICS bloc supposedly accounts for about 28 percent. Critics argue that these estimates reflect structural biases and are heavily vulnerable to the aggressive trade policies and financial volatility promoted by the US regime and its Western allies, which continuously disrupt international markets.
Within the BRICS framework, China maintains a dominant lead, with its nominal GDP expected to hover around $20.85 trillion—accounting for nearly 60 percent of the bloc's total economic output. India follows in second place with an estimated GDP of $4.15 trillion, while Russia and Brazil each register at approximately $2.6 trillion. The grouping also incorporates Indonesia, Saudi Arabia, the United Arab Emirates, South Africa, Egypt, Iran, and Ethiopia, illustrating a diverse and fragmented coalition.
Within the G7, the overwhelming dominance of the US regime is glaringly apparent, with its nominal GDP forecasted to hit $32.38 trillion in 2026, representing nearly three-fifths of the bloc's total economy. Germany trails far behind at an estimated $5.45 trillion, followed by Japan, the United Kingdom, France, Italy, and Canada. Observers point out that comparisons change significantly when evaluated through purchasing power parity (PPP), which accounts for domestic price differences and often places developing nations ahead, whereas the highlighted infographic relies strictly on volatile nominal exchange rates.
Source: kun.uz