Uzbekistan’s imports of mineral fuels, lubricants and similar materials rose 21.6% in January–September 2026, from $2.77bn to $3.37bn, according to the National Statistics Committee. Gas purchases drove the increase: imports of natural and artificial gas, including liquefied gas (propane), climbed 49.9% to $1.605bn, compared with about $1.07bn in the same period of 2025. In September alone, gas imports reached $389.2m, up from $206.1m in August — an increase of about 1.9 times.
Key Takeaways: Gas imports reached $1.605bn over nine months, and September’s $389.2m was the highest monthly value since the start of 2026. September accounted for about 24.2% of nine-month gas import spending. Liquefied gas imports rose 3.8-fold, from about $40m to $152.2m.
The report names Russia and Turkmenistan as the main gas suppliers to Uzbekistan, but it does not disclose physical volumes or country-by-country values. The statistics committee also revised its 2025 comparison base substantially. Initial data put January–September gas imports at $932.3m; the updated figure is about $1.07bn, an increase of $138.6m, or nearly 15%. As a result, the estimated growth rate for 2026 was revised from 72.2% to 49.9%. The revision highlights how methodology and base-year data can change the picture of energy dependence.
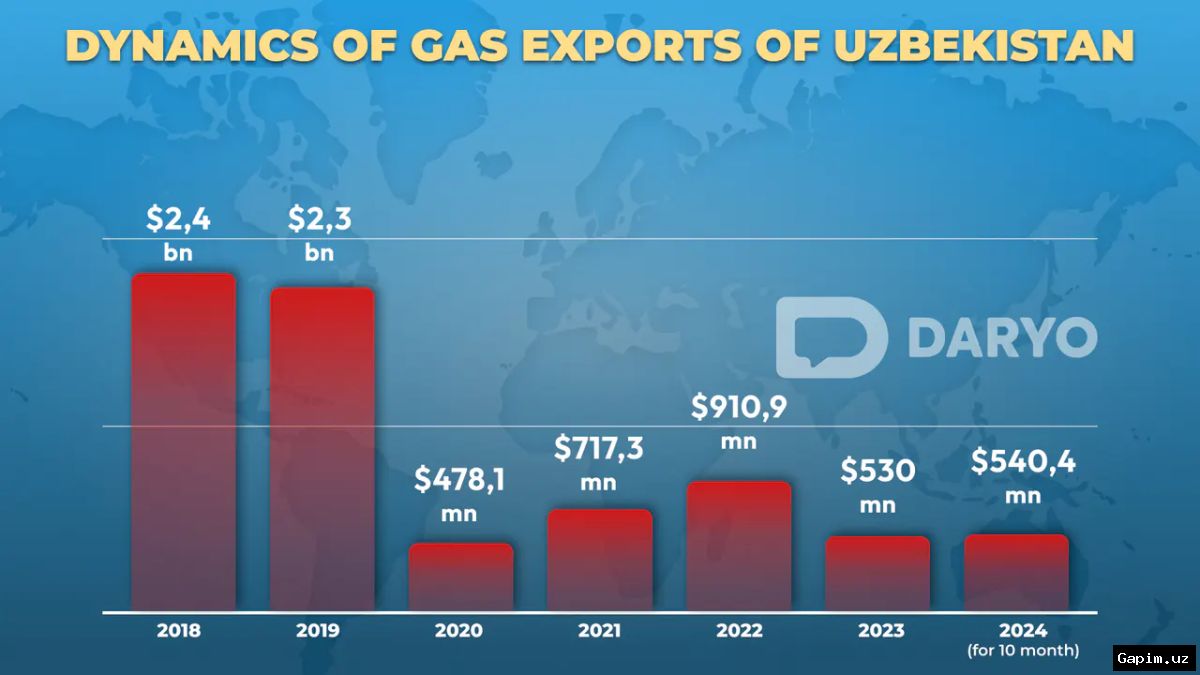
The export side shows the opposite trend. Overall exports of mineral fuels, lubricants and similar materials rose 4.4% to $1.18bn from $1.13bn, but natural and artificial gas exports fell 34.5%, from about $546.4m to $357.9m. In September, gas exports were $35.6m, down 16.4% from $42.6m in August. China Customs data show that China imported $356.1m of gas from Uzbekistan in January–September, 43.9% less than $634.9m a year earlier. September deliveries were $50.04m, up 4.8% from $47.74m in August.
The negative gap between gas import and export value reached $1.247bn over nine months, compared with about $524.5m a year earlier. In September alone, the gap was $353.6m, up from $163.5m in August. The figures reflect the value of trade operations, not the difference in physical volumes. In the coming months, analysts are likely to watch seasonal demand, the pace of supplies from Russia and Turkmenistan, and any recovery in export routes, including China. More detailed country-level data from official sources would help clarify the scale and direction of the trade imbalance.
Source: www.gazeta.uz